Crypto Candlestick Chart Guide: Pattern Recognition and Trend Trading for Beginners
Every candlestick is a real-time record of the battle between bullish and bearish forces in the market. It uses four prices to depict the full picture of a trading day: the opening price marks the start of the race, while the closing price captures the result of the day’s combat. When the closing price is higher than the opening price, a green bullish candle (commonly used in Chinese charts) indicates a victory for the bulls; a red bearish candle means the bears are in control. The length of the body represents the strength of the winning side—long bodies suggest a dominant victory, while short bodies imply a close contest. The wicks extending from the body faithfully record the highest and lowest points of intraday battles, like traces of charges and retreats on a battlefield.
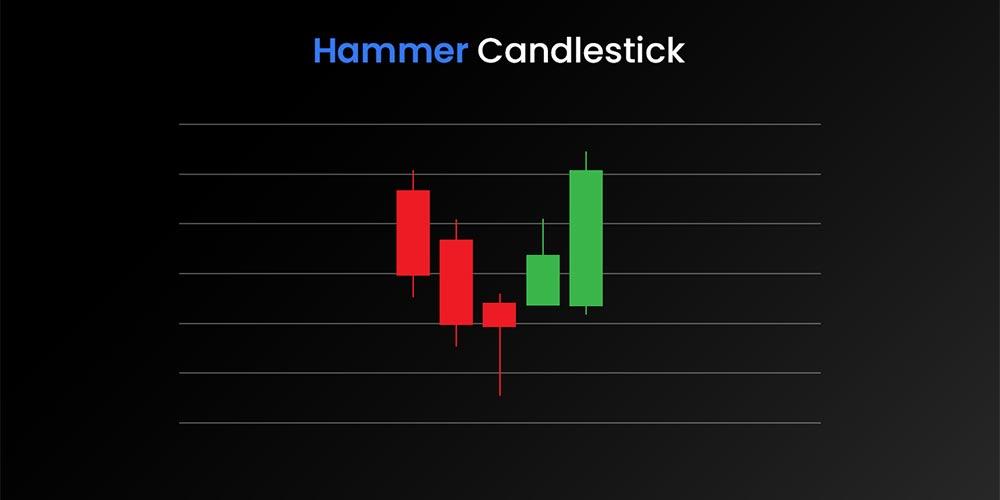
Hammer Candlestick Pattern Explained
When a cryptocurrency experiences a continuous decline followed by a candle with a very small body and a long lower wick—resembling a hammer—it signals a potential bullish reversal. This pattern reveals a dramatic turn: although bears pushed the price to new lows (as shown by the long lower wick), a sudden influx of buyers drove the price back up by the close. In March 2025, Bitcoin’s weekly chart vividly demonstrated this: the price plunged to a low of $81,444 but closed near $85,000, forming a textbook hammer. A 23% rebound over the next two weeks confirmed the hammer’s warning signal of a bullish counterattack.
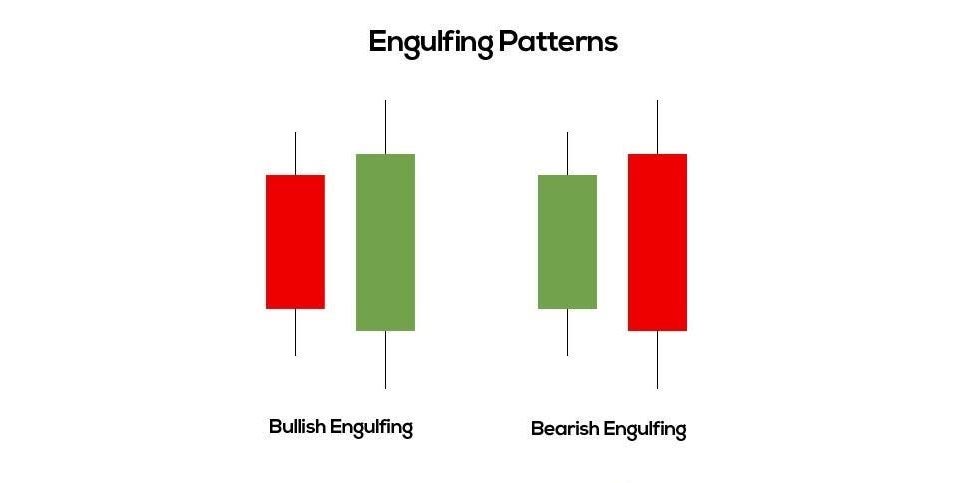
Engulfing Pattern Identification and Use
The engulfing pattern often indicates a complete trend reversal. When a bullish candle fully engulfs the body of the previous day’s bearish candle, it signals that bulls have taken control with overwhelming strength. This pattern requires significant capital flow to form, making it highly reliable. On Solana’s daily chart in June 2025, a strong bullish candle from $115 to $135 completely engulfed the previous day’s bearish candle, like light consuming darkness. Following this signal, SOL surged 40% within ten days, fully demonstrating the engulfing pattern’s role in confirming trend reversals.
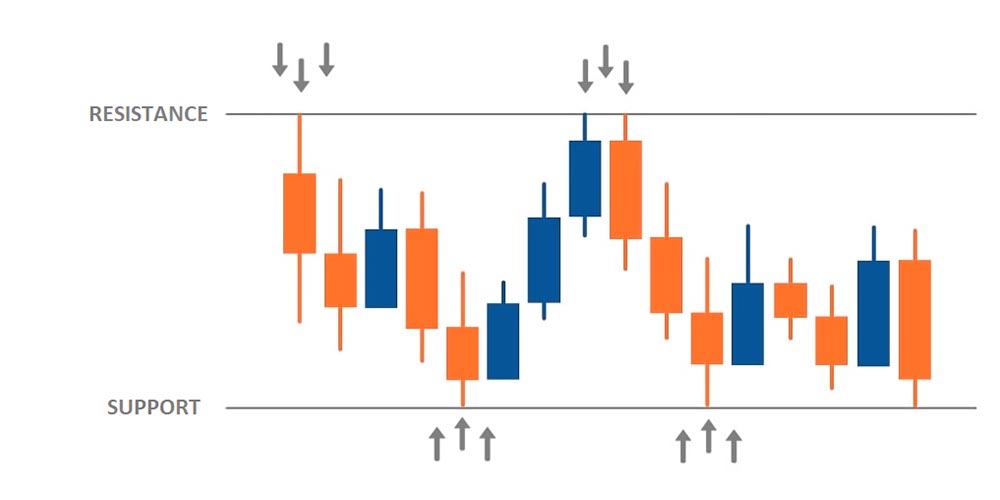
The Principle of Support and Resistance
Support and resistance levels are psychological defenses formed by collective market memory. Support is created by multiple unbroken lows, like a fortress held by bulls; resistance is formed by repeated highs that fail to break, like a barrier defended by bears. Ethereum’s battle around the $3,200 level in 2025 is a classic example: during four attempts to break through, candlesticks showed long upper wicks (bearish pressure) and buying support around $3,150 (bullish defense). When the fifth breakout succeeded with volume, the former resistance turned into a new support zone—vividly illustrating the market principle of “resistance becomes support.”
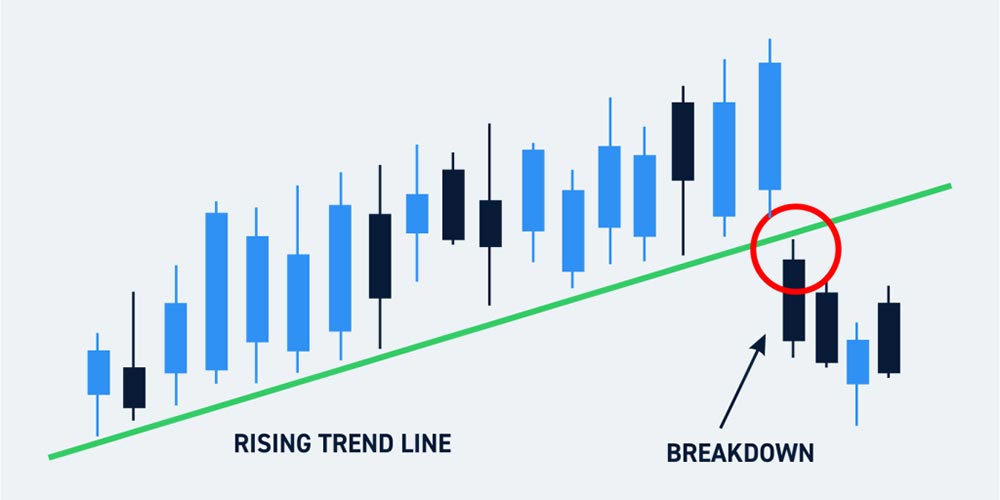
Trendline Drawing and Trading Significance
Connecting two progressively higher lows creates an upward trendline; connecting two descending highs forms a downward trendline. This seemingly simple line serves as a compass for market direction. On Cardano’s weekly chart in 2025, when the price retested the trendline connecting the $0.38 and $0.42 lows for the third time, it rebounded like a spring—marking a precise entry point in line with the trend. Note: two points only suggest a potential trend; a third touch and bounce confirm its validity.
Practical Use of Price Channels
Building on trendlines, drawing a parallel line from the first significant high creates a price channel. This channel offers clear reference boundaries for trading. In an upward channel, prices often find support when touching the lower boundary (e.g., Bitcoin at $60,000), suitable for buying dips; touching the upper boundary (e.g., $64,000) may invite selling pressure—ideal for partial profit-taking. In BNB’s channel trading in July 2025, the price touched the $580 upper boundary for the fifth time with shrinking volume, signaling weak breakout momentum. It then fell to the $540 lower boundary, which provided support—perfectly demonstrating the power of channel boundaries.
Multi-Indicator Confluence Case Study
High-probability trading opportunities often arise from the confluence of multiple technical signals. Bitcoin’s daily chart in May 2025 offered a classic example: when the price fell to $56,000, a hammer candlestick formed with a lower wick three times the body length (pattern signal). Support analysis showed the price precisely retested the rising trendline connecting March’s $51,000 and April’s $54,000 lows (trend confirmation), and this area coincided with the lower boundary of a 4-hour rising channel (channel validation). The RSI indicator also dropped to 28 (oversold zone), creating a four-signal confluence that triggered a 22% rally within 15 days.
The Essence and Limitations of Technical Analysis
Candlestick charts are like fossils of market sentiment—recording the historical struggle between bulls and bears, but incapable of predicting sudden future events. Hammer reversals and engulfing takeovers all reflect an eternal truth: price is driven by collective human behavior, and human nature never changes. Real technical analysis isn’t fortune-telling, but studying historical patterns to build probabilistic edges in chaos. When you can interpret wick lengths to read the strength of market forces, or sense capital flow from trendline angles—you’ve grasped the core value of technical analysis: finding certainty within uncertainty.
Final Advice for Beginners
First, master three basic patterns (hammer, engulfing, dark cloud cover).
Then, understand how support and resistance dynamically shift.
Finally, use trendlines to determine market direction.
Step by step, and you will find the truth.
-
Sign Up

OKX
OKX is a leading global digital asset trading platform offering spot and derivatives services for cryptocurrencies.
-
Sign Up

Binance
Binance is one of the world's largest cryptocurrency exchanges, offering spot, futures, staking, and a wide range of digital asset services.
-
Sign Up

Bybit
Bybit is a global cryptocurrency exchange specializing in derivatives, spot trading, and crypto-financial products.
-
Sign Up

Gate.io
Gate.io is a leading crypto exchange offering diverse trading options, low fees, and strong security since 2013.