What Are the Technical Indicators in Crypto? A Beginner’s Advanced Guide
In cryptocurrency trading, technical indicators are values calculated using mathematical formulas designed to analyze price movements and forecast future trends. These indicators generally fall into two categories: trend indicators and oscillators. Trend indicators help determine the market's direction, while oscillators are used to identify overbought or oversold conditions. For beginners stepping into crypto trading, understanding how these indicators work and when to apply them is essential.
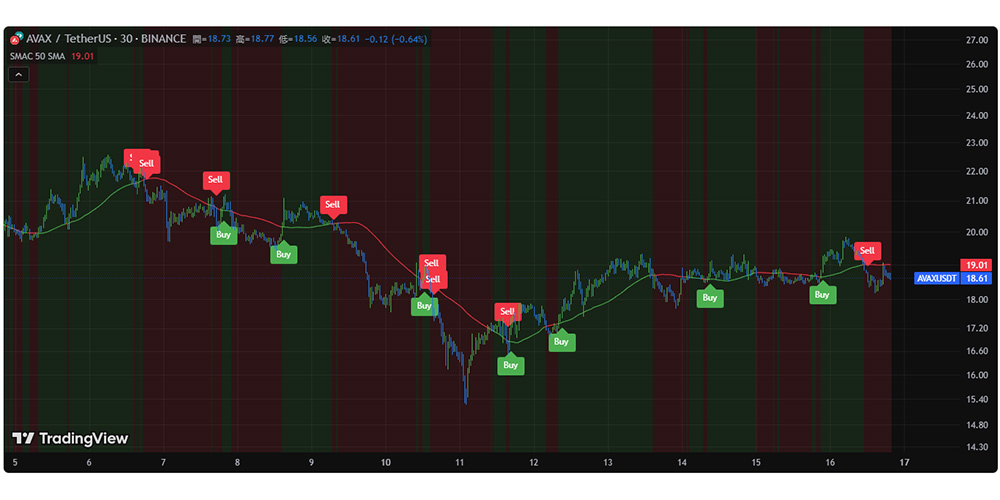
Moving Averages (MA)
The moving average is one of the most basic and commonly used trend indicators. It smooths out price fluctuations by calculating the average price over a specific time period, providing a clearer view of the price trend. A Simple Moving Average (SMA) gives equal weight to each price point, while an Exponential Moving Average (EMA) places more emphasis on recent prices.
In crypto markets, short-term traders often use 5-day or 10-day EMAs, while medium- and long-term investors pay attention to the 50-day or 200-day MAs. When a short-term MA crosses above a long-term MA, it forms a golden cross, typically seen as a buy signal. Conversely, a death cross may indicate the beginning of a downtrend.
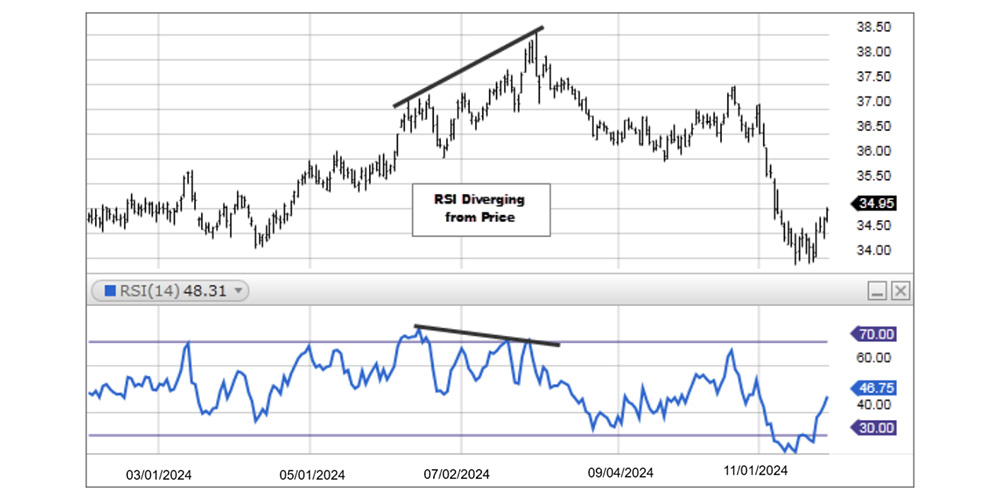
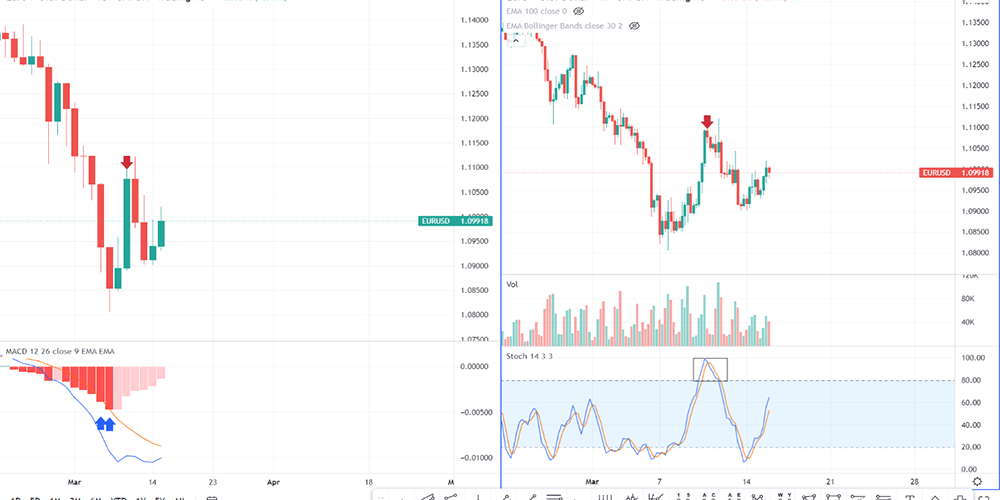
Relative Strength Index (RSI)
RSI is a momentum oscillator that measures the speed and magnitude of price changes, ranging from 0 to 100. Generally, an RSI above 70 suggests an asset may be overbought, while an RSI below 30 indicates it might be oversold. In a highly volatile market like crypto, RSI can be particularly useful.
However, during strong trends, RSI may remain in the overbought or oversold zone for extended periods. Therefore, it's best used in conjunction with other indicators. For instance, when Bitcoin is in an uptrend, RSI might hit 70 multiple times without an immediate pullback. Relying solely on RSI to short may cause traders to miss further gains.
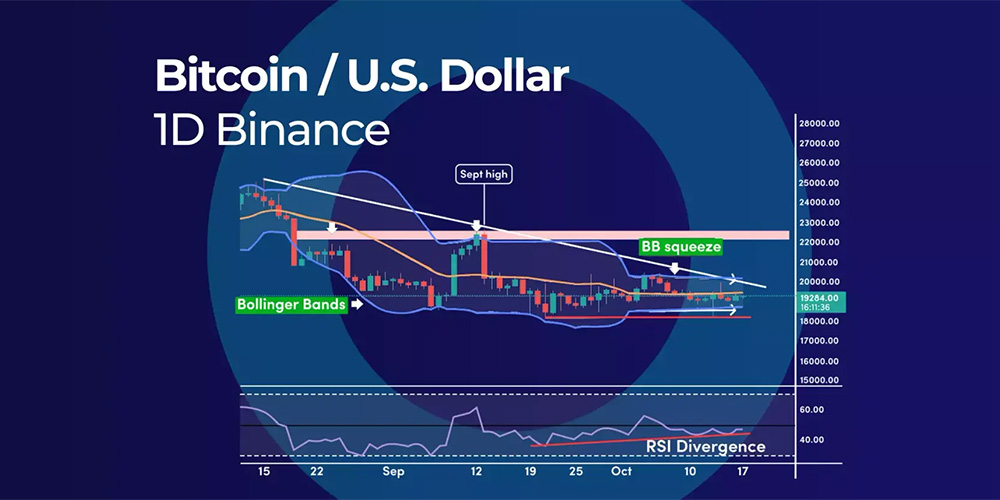
Bollinger Bands
Bollinger Bands consist of three lines: a middle line (SMA), and an upper and lower band, which are the SMA plus or minus two standard deviations. This indicator reflects market volatility and relative price levels. When the price touches the upper band, it may signal overbought conditions; touching the lower band may indicate oversold conditions.
In crypto trading, Bollinger Band squeezes often signal reduced volatility and potential breakout points, while band expansion indicates increasing volatility. Note: in strong trends, prices can ride the upper or lower band for long periods — countertrend trades during such moves can be risky.
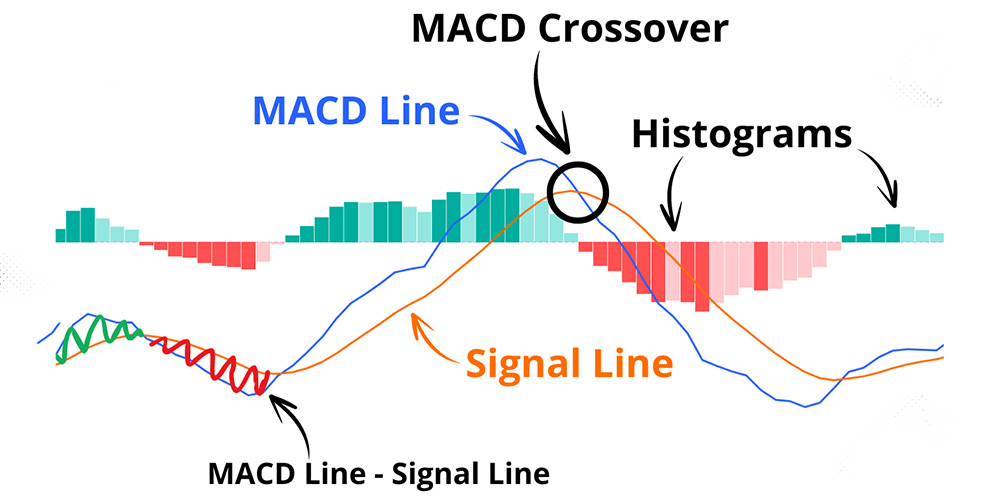
MACD (Moving Average Convergence Divergence)
MACD is a powerful indicator that combines trend and momentum analysis. It consists of the MACD line (short-term EMA minus long-term EMA), the signal line (EMA of the MACD line), and a histogram.
A buy signal occurs when the MACD line crosses above the signal line; a sell signal when it crosses below. MACD is particularly good at identifying trend starts and ends in the crypto market. For example, during Bitcoin’s 2021 bull run, MACD accurately identified several key turning points. However, in ranging markets, MACD may produce false signals, so caution is advised.
Volume Indicators
Volume is a critical confirmation tool for price action. In crypto trading, rising prices accompanied by increasing volume typically signal a strong trend. If prices rise while volume shrinks, it may suggest weakening momentum.
Volume Weighted Average Price (VWAP) is a popular indicator for intraday traders. It reflects the “average cost” of the market. A price above VWAP is often viewed as strong, while below it can be seen as weak. Sudden volume spikes can precede major price movements, so monitoring volume can help traders spot trend shifts early.
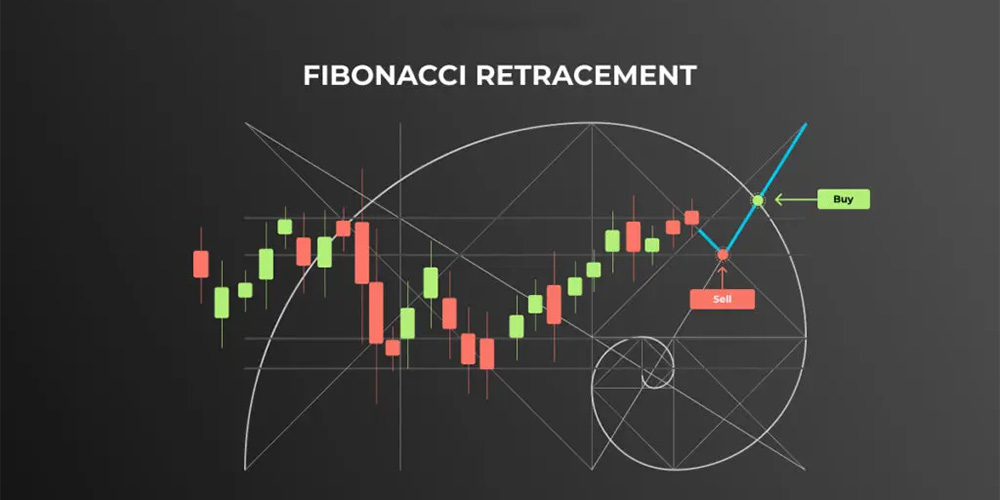
Fibonacci Retracement
Fibonacci retracement is a tool based on the Fibonacci sequence, used to identify potential support and resistance levels. In crypto, the key retracement levels — 23.6%, 38.2%, 50%, and 61.8% — are often areas where prices reverse.
For example, after a Bitcoin rally, traders look at these levels to see where the pullback might find support. In a downtrend, they may serve as resistance during rebounds. Note: Fibonacci tools work best in clearly trending markets and may be less reliable in sideways conditions.
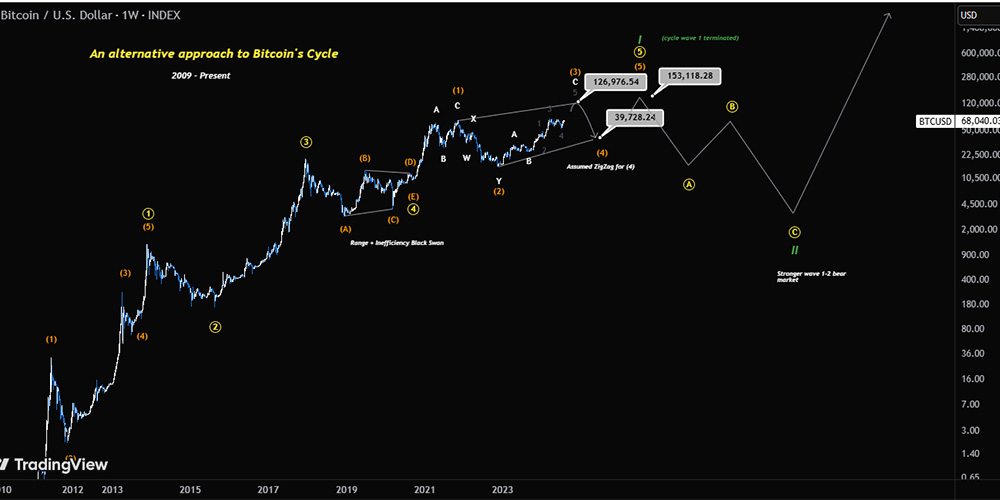
Elliott Wave Theory
Though not a traditional indicator, Elliott Wave Theory provides a valuable framework for analyzing crypto markets. It suggests that markets move in a five-wave advance followed by a three-wave correction.
In Bitcoin’s historical patterns, this wave structure has been observed several times. The 2017 bull run, for example, followed a full five-wave cycle. Mastering wave theory can help traders understand market positioning and make informed decisions. However, wave counts can be subjective and should be confirmed with other indicators.
Multi-Timeframe Analysis
Experienced traders often analyze indicators across multiple timeframes. For example, if the daily chart shows an uptrend while the 4-hour chart shows an overbought RSI, it might suggest a short-term pullback within a larger uptrend.
This method helps avoid errors caused by signals from a single timeframe. In crypto, common combinations include:
-
Weekly chart for identifying macro trends
-
Daily chart for spotting trade setups
-
Hourly chart for fine-tuning entry points
Conclusion
Technical indicators are essential tools for crypto traders, but no single indicator is perfect. Successful trading requires combining multiple indicators and interpreting them within the market context.
For beginners, it's best to start with basics like moving averages and RSI, then gradually explore more advanced tools. Always remember: indicators are aids, not oracles. Real trading decisions should be based on a holistic understanding of the market.
With time and experience, you’ll develop a personalized set of indicators and strategies that suit your trading style. Most importantly, keep a learning mindset — the crypto market is always evolving, and your approach must evolve with it.
-
Sign Up

OKX
OKX is a leading global digital asset trading platform offering spot and derivatives services for cryptocurrencies.
-
Sign Up

Binance
Binance is one of the world's largest cryptocurrency exchanges, offering spot, futures, staking, and a wide range of digital asset services.
-
Sign Up

Bybit
Bybit is a global cryptocurrency exchange specializing in derivatives, spot trading, and crypto-financial products.
-
Sign Up

Gate.io
Gate.io is a leading crypto exchange offering diverse trading options, low fees, and strong security since 2013.